
Module
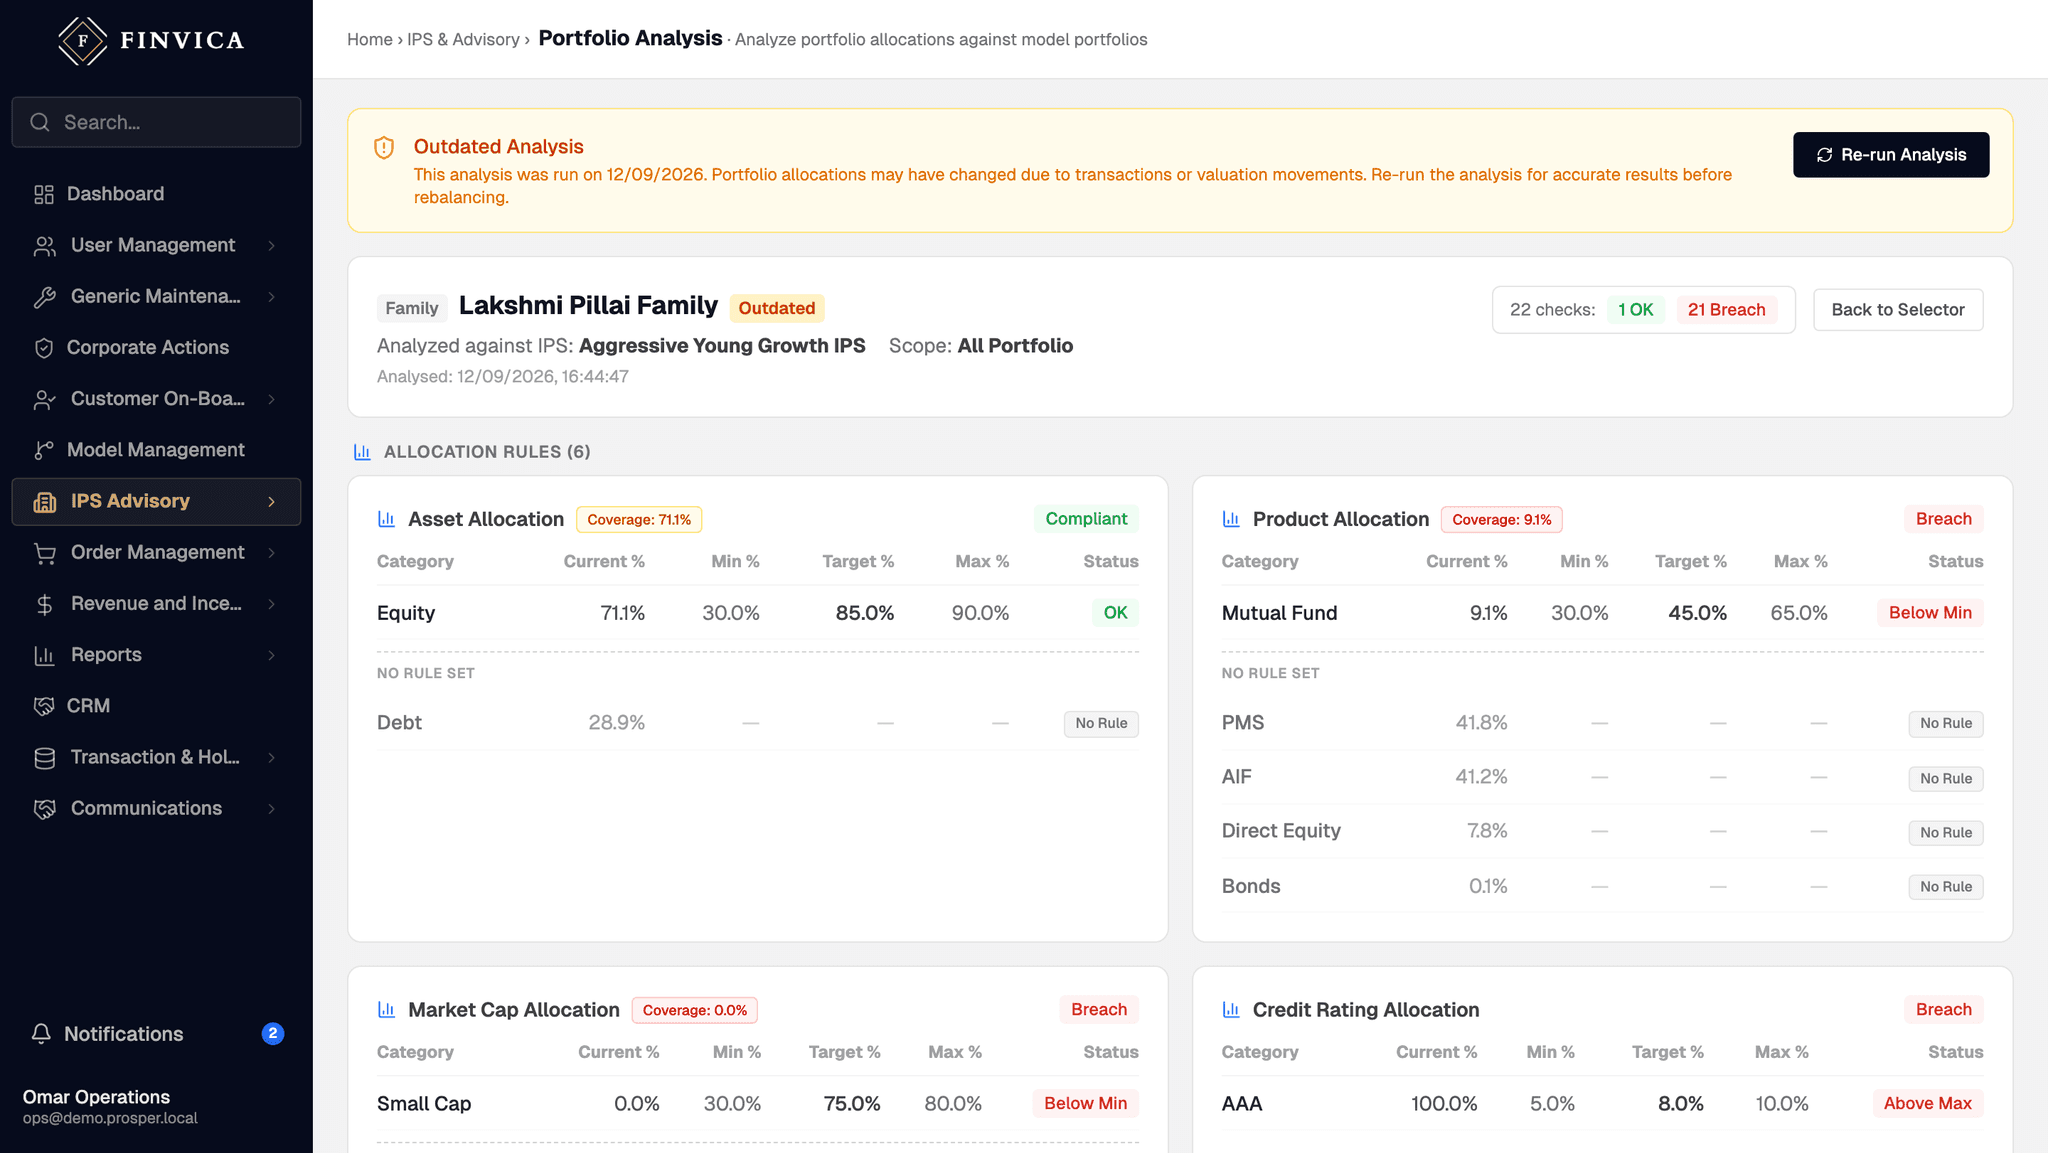
Portfolio analytics — Overlap, concentration and drawdown — before the client asks.
Without it
What this costs you today.
Two funds that look diversified can hold the same twelve stocks. You find out when the client asks why both fell together, which is the worst possible moment to discover it.
What it does
Business rules, not adjectives.
Holdings overlap between schemes a client owns.
Concentration by issuer, sector and asset class across the whole book, not per scheme.
Drawdown and volatility over selectable periods.
Returns computed on a stated basis — XIRR where cash flows are irregular.
Analysis spans every class, not only the ones with clean data.
On screen
Portfolio analytics, as it ships.
Coverage
Which product classes this covers.
Analytics cover the classes with position and price data. Where a class values from a statement, the analysis reflects that basis rather than assuming a price series.
How it works
Three or four steps, in order.
Pick the portfolio
A client, a family, a group or the whole book.
Read the exposure
Overlap, concentration, drawdown.
Take it to the client
With the reasoning attached rather than the conclusion alone.
Questions about portfolio analytics.
Does it show overlap between funds?
Yes — holdings overlap across the schemes a client owns, which is the question that matters and the one most tools cannot answer.