
Module
Dashboards — The number you need, and the three clicks to what is behind it.
Without it
What this costs you today.
A dashboard that shows a number nobody can explain is worse than no dashboard. The question is always "why is that figure what it is", and most tools answer it with a PDF export.
What it does
Business rules, not adjectives.
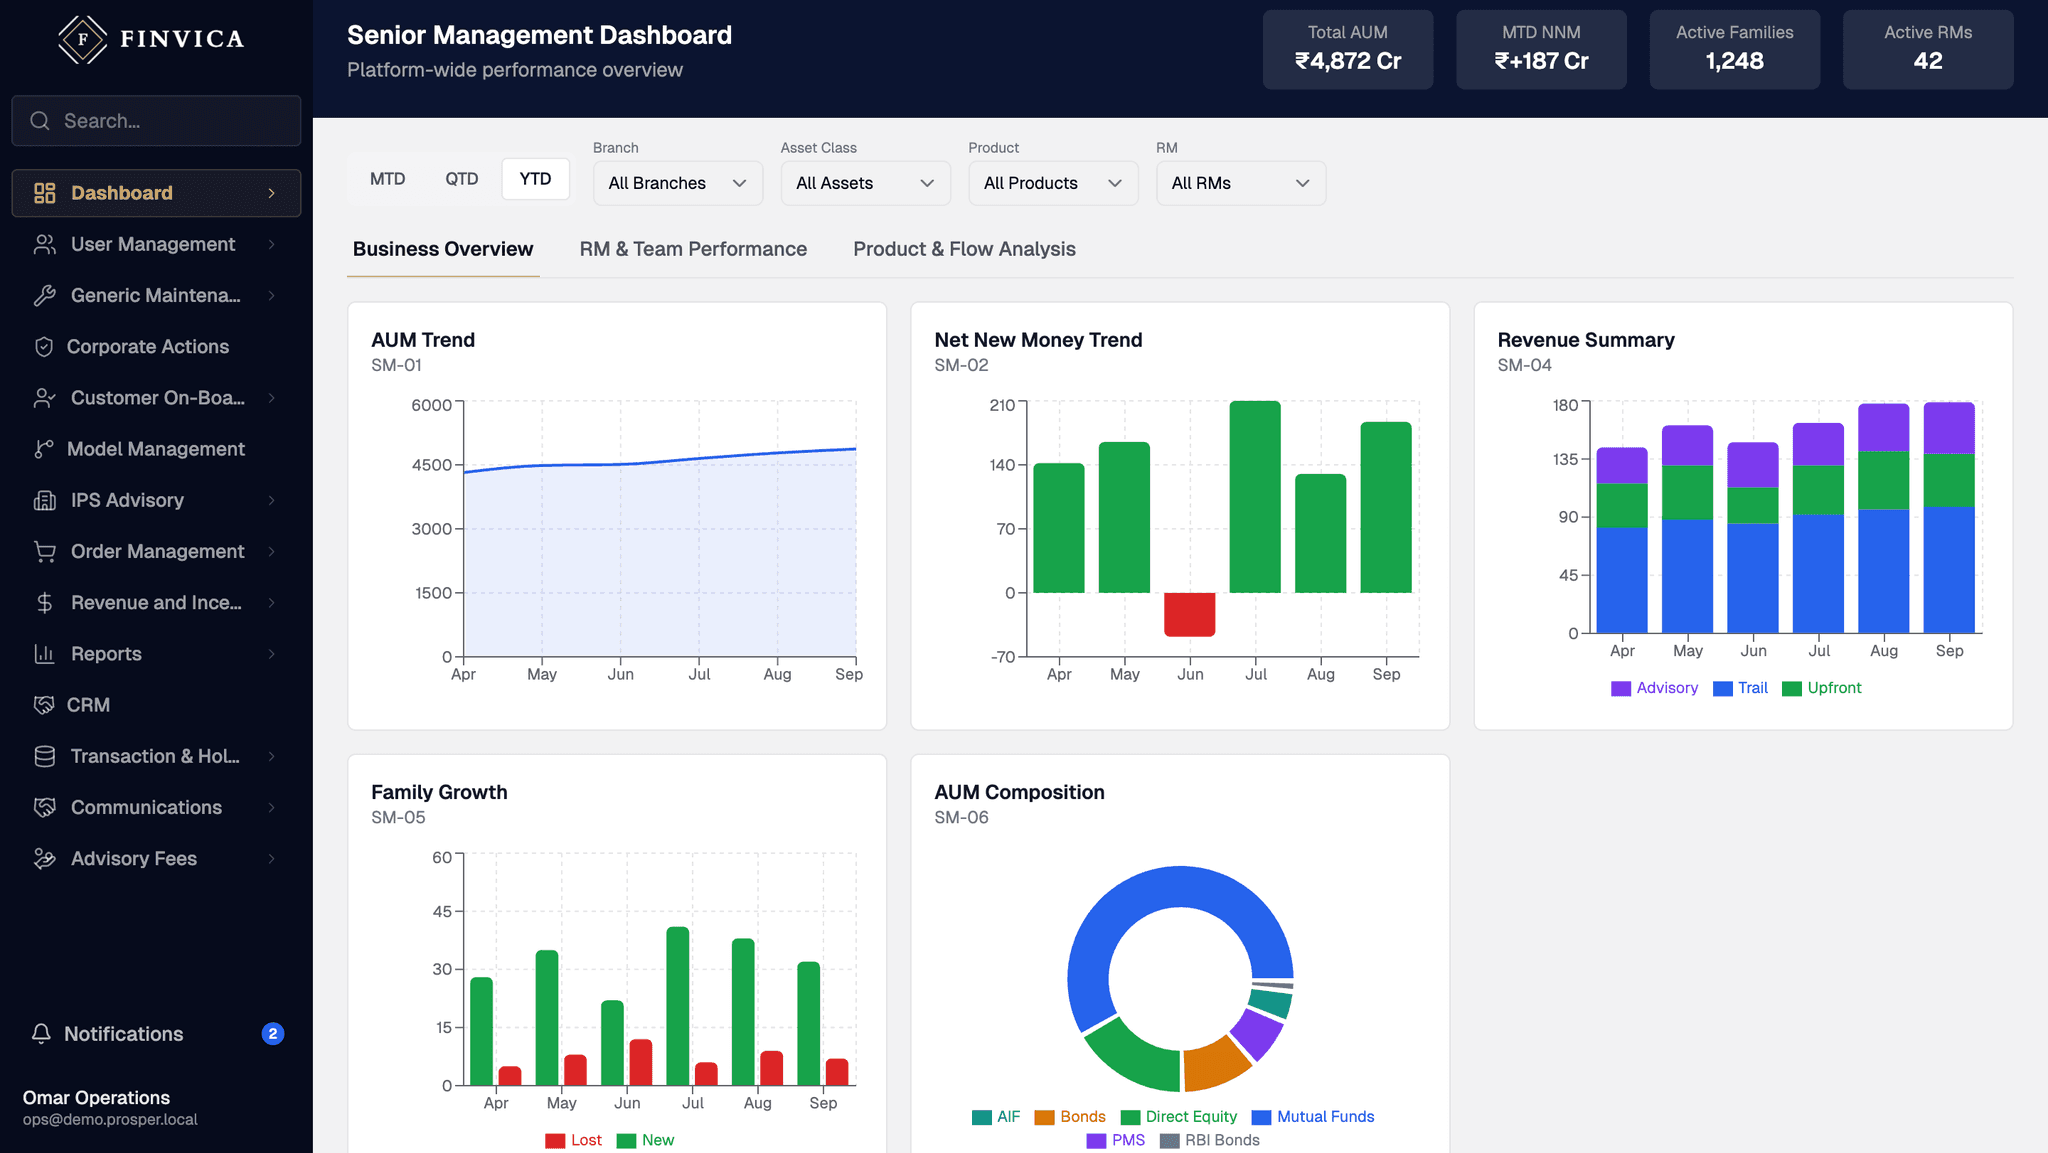
AUM, the SIP book, revenue and pending items on one view.
Every headline number drills through to the rows behind it.
The view follows the role — a relationship manager sees their book, a branch head sees the branch.
Figures are as at a stated time rather than ambiguously current.
On screen
Dashboards, as it ships.
Coverage
Which product classes this covers.
Aggregates across every product class on the book.
How it works
Three or four steps, in order.
Open on the summary
What the practice looks like this morning.
Drill into a number
To the clients and transactions that produce it.
Act from there
The record you need is one click from the figure that raised the question.
Questions about dashboards.
Can different users see different dashboards?
Yes. The view follows role and position in the hierarchy, so nobody sees a book that is not theirs.